FINANCIALS & DEMOGRAPHICS
___________________________________________________
JULY 1, 2016 - JUNE 31, 2017

FINANCIALS & DEMOGRAPHICS
JULY 1, 2016 - JUNE 31, 2017
Financials
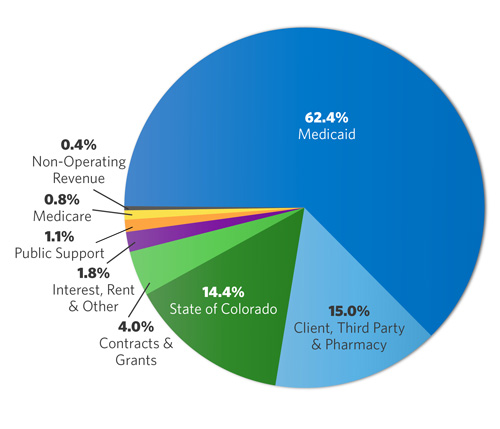
Total Revenue: $98.5 Million
Source of Dollars

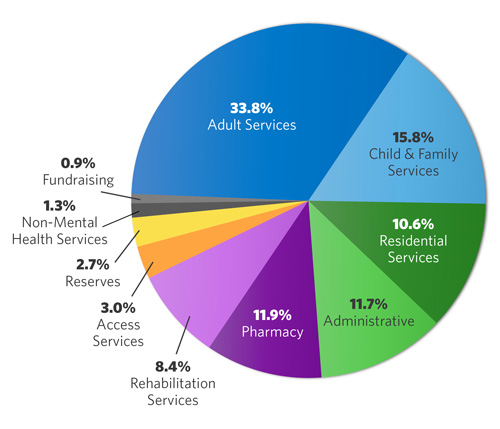
Use of Dollars

Demographics
People Served
The WellPower provided treatment and prevention services to 18,786 unique individuals.
An additional 43,221 children, families and adults were provided outreach services.
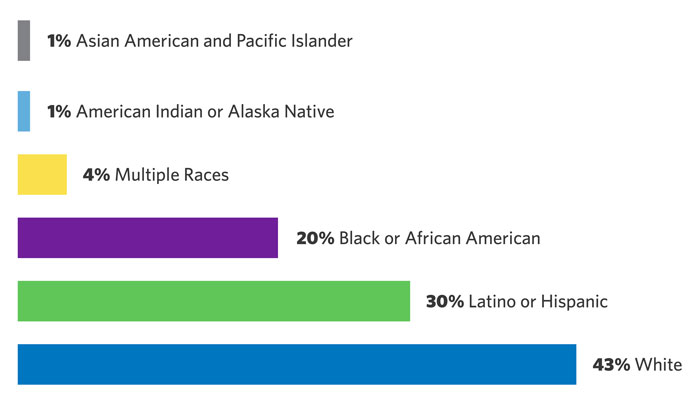
Race* & Ethnicity**

*Does not include “declined to answer” or “unknown” race
**People we serve who identify as Latino or Hispanic may belong to any race
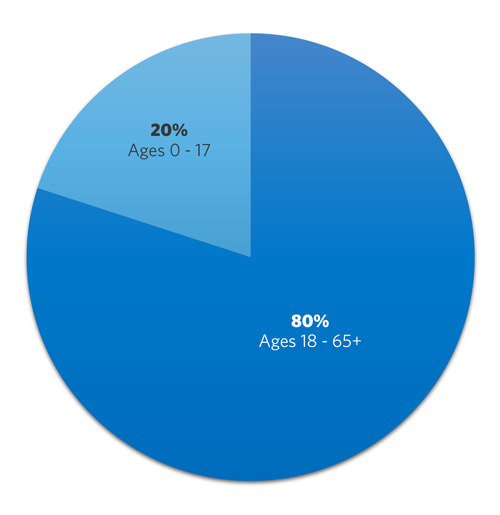
Age


